 Charitable Giving & Volunteerism: An Eco-System for Greater Resilience
Last week, the 2020 Giving USA report was released which offers up key statistics on charitable giving trends in the US.
Although, the data is from 2019 – which feels like a long time ago after the pandemic hit – it offers some hope as nonprofits look toward re-opening their doors sometime in the future.
Giving USA is the longest-running data series on all sources and uses of philanthropy in the country. As such, it provides a helpful lens through which to look at adjustments that nonprofit staff might make to boost the impact of giving, whether through gifts of funds or gifts of time and talent.
Important to note, the individual giving included in this report does not represent all charitable sector revenue. Rather, giving by individuals represents the third highest source of revenue for charities (at $265 billion in 2019), after program fees from private sources ($1 trillion) and federal funding ($491 billion), according to the Nonprofit Quarterly’s most recent Illustrated Nonprofit Economy.
In 2019, the economic outlook for the country and the nonprofit sector was relatively bright and showed a lot of promise, some calling it a “bountiful year” for philanthropy.
Below are a few stats and facts from giving USA 2020 (representing data from 2019) about who is giving, presented in a recent NPQ webcast:
- Giving reached nearly $450 Billion in 2019, and the last three years have represented the highest level of giving ever recorded (even when adjusted for inflation).
- Giving by corporations rose by 13.4%, giving by individuals by 4.7%, and giving by foundations by 2.5%.
- There are strong correlations in the level of household giving and the economy, with a dip during the last great recession, but also a surge in giving during the tech boom in the 1990s for example.
- Of all philanthropic contributions, individuals gave by far the most, with 69% of all gifts from living individuals and 10% in the form of bequests. Corporations stand for only 5% of all philanthropy and foundations only 17% (about half from family foundations).
- That said, the overall market share of giving by individuals has decrease by 12% in the last 40 years (at 50.9% in 1994), from 82% on 1980-1984 to 70% on 2015-2119.
In addition, below are a few stats and facts about where funds go:
- Faith-based organizations enjoy nearly a third (29%) of all philanthropic contributions; however, that market share has decreased over time (40 years it was over half).
- Education comes in second at 14% of all contributions with human services and gifts to grant-making foundations tied at third place (at 12%).
- In terms of trends, donations to “public society benefit” organizations like the United Way and employee giving programs have grown by double digit figures (growth rate of 13.1% from 2018 to 2019), as well as arts, culture, and humanity organizations (growth rate of 12.6%), education (growth rate of 12.1%), and environment and animals (growth rate of 11.3%).
All this looks pretty good, but there are reasons to be cautious, as well.
Since 2013, the total number of US 501(c) 3 charitable organizations has steadily increased with a total of 1,327,714 filing with the US Internal Revenue Service in 2019. That said, household giving has not kept pace. The number of charities is growing at twice the amount of giving.
So, competition between charitable organizations for donations is on the rise.
In addition, total giving correlates with the economy and dips are experienced during economic recessions, even when giving as a percentage of Gross Domestic Product (GDP) was at around 2% most years over the past 20 years. Corporate giving, on the other hand, has consistently run at only 1% of corporate pre-tax profits for nearly a decade.
Still, historically more people donate than vote, and philanthropy consistently shows our social values as a civil society.
But times may be changing.
How Can Nonprofits Remain Resilient in Uncertain Times?
Nearly every aspect of our lives has been up-ended by the current COVID-19 pandemic. The way we approach our health, work, social interactions and lifestyles, worries about the economy, how we think about service to others, our lithe fabric of society in general.
With these disruptions, it’s likely that philanthropy will be changed as well, but the future remains unclear. Anecdotally, there have been disruptions in how people are supporting causes they care about with a decrease in volunteering, so we may well experience an increase in financial contributions.
Some nonprofit supporters are already switching roles as their own personal circumstances change – donors lose jobs and income, so they switch to volunteering. Volunteers get a stimulus check they’d like to put to good use and make a donation.
While everything is in flux, that doesn’t mean that nonprofits can’t take action to better ensure their resilience.
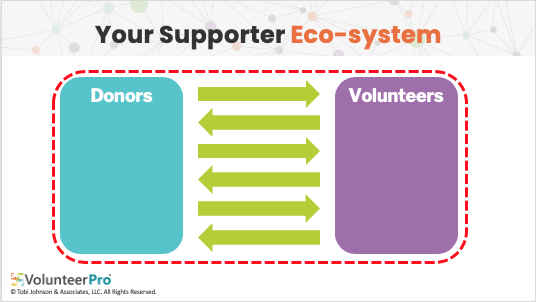
The first order of business is to re-consider the arbitrary silos between donors and volunteers.
Are volunteers and donors really different groups in the first place?
Survey says … nope.
Research from Fidelity Charitable® notes that most (79%) donors volunteered in the last 12 months, and 87% of volunteers say there is an overlap between their volunteer and financial support.
In fact, half (50%) of volunteers say they give more financial support because they volunteer.
Among those volunteers, more than two-thirds (67%) committed 50 or more hours to volunteering, with nearly half (49%) volunteering for three or more organizations. Furthermore, 84% of volunteers expect to keep or increase volunteering commitments in coming years.
Given the fact that nonprofits lose 57-61% of donors every year, and our economic future is tenuous, it makes sense to think about volunteers and donors as an eco-system of a support, rather than two disparate groups that require separate strategies.
In fact, the more that development and volunteer services can work together, the better they will be able to coordinate messaging, campaigns, and data analysis.
Donor loyalty research from Abila has found that the majority of donors give more than four times annually to their favorite organization, and most spread their contributions to multiple organizations.
They also found a clear connection between contributions of money and time, with high-wealth donors ($200,000+) being 16% more likely to volunteer, with 80% of those volunteering in a leadership role.
Perhaps most interesting, is the fact that BOTH in-person events AND the ability to get involved through volunteerism correlate closely with increased giving and donor engagement.
While 74% of those attending an event reported they are much more or somewhat likely to contribute money, volunteering has equal power, with 73% reporting they are much more or somewhat likely to contribute money after volunteering.
In fact, research shows that donors feel most engaged with a nonprofit when either volunteering or making financial contribution, at equal levels.
The bottom line? When it comes to your supporters, volunteers are donors and donors are volunteers.
Action Steps
 Given this reality, here are a few action steps to consider.
- Build an integrated strategy that combines development and volunteer engagement activities and tracks the movement and depth of engagement of supporters across the continuum of giving from financial contributions to volunteer leadership.
- Continue to engage supporters as both donors AND volunteers, even if they can’t serve in person due to safety concerns. People stay committed to causes they care about and volunteerism and giving will reinforce one another.
- Focus on retention of both volunteers and donors, especially those who have just joined you. Research from the Benefactor Group shows that only 20% of first-time donors make a second gift. Find ways to involve them in giving and remote volunteering to increase the depth of engagement.
- Focus on building and deepening relationships with supporters through social media, online conversations, and invitations for advocacy and micro-volunteering efforts that anyone can take on for brief, episodic engagements.
- Be guided by your data about volunteer and donor behavior. Know your current benchmarks so you know where you need to focus your energy and where you are gaining traction. if you don’t have the data, now’s the time to set up a system to gather it.
- Don’t assume doom and gloom. Past experience has shown that giving and volunteering isn’t always negatively affected by crisis. Consider the bump in giving after the 9/11 terrorist attacks. You can still reach your supporter engagement goals. It just going to take a strategy to work smarter not harder.
While there is no way to know what will happen in the future, there’s no reason why organizations should push the pause button on supporter engagement. In fact, the opposite is true.
It will be the nonprofits who keep their supporters close who will be better position to not only survive but thrive.
Experience has taught us that natural disasters often result in a brief uptick in giving and that economic recessions correlate with lower levels of giving. Which trend will take precedence in the current time is anyone’s guess.
However, one thing is certain, philanthropy and total household giving has been on the rise for over a decade now, and the organizations that develop relationships with a broad eco-system of support will be the ones best positioned to raise their share of support in an increasingly competitive market.
This includes both donors and volunteers.

Leave A Comment